
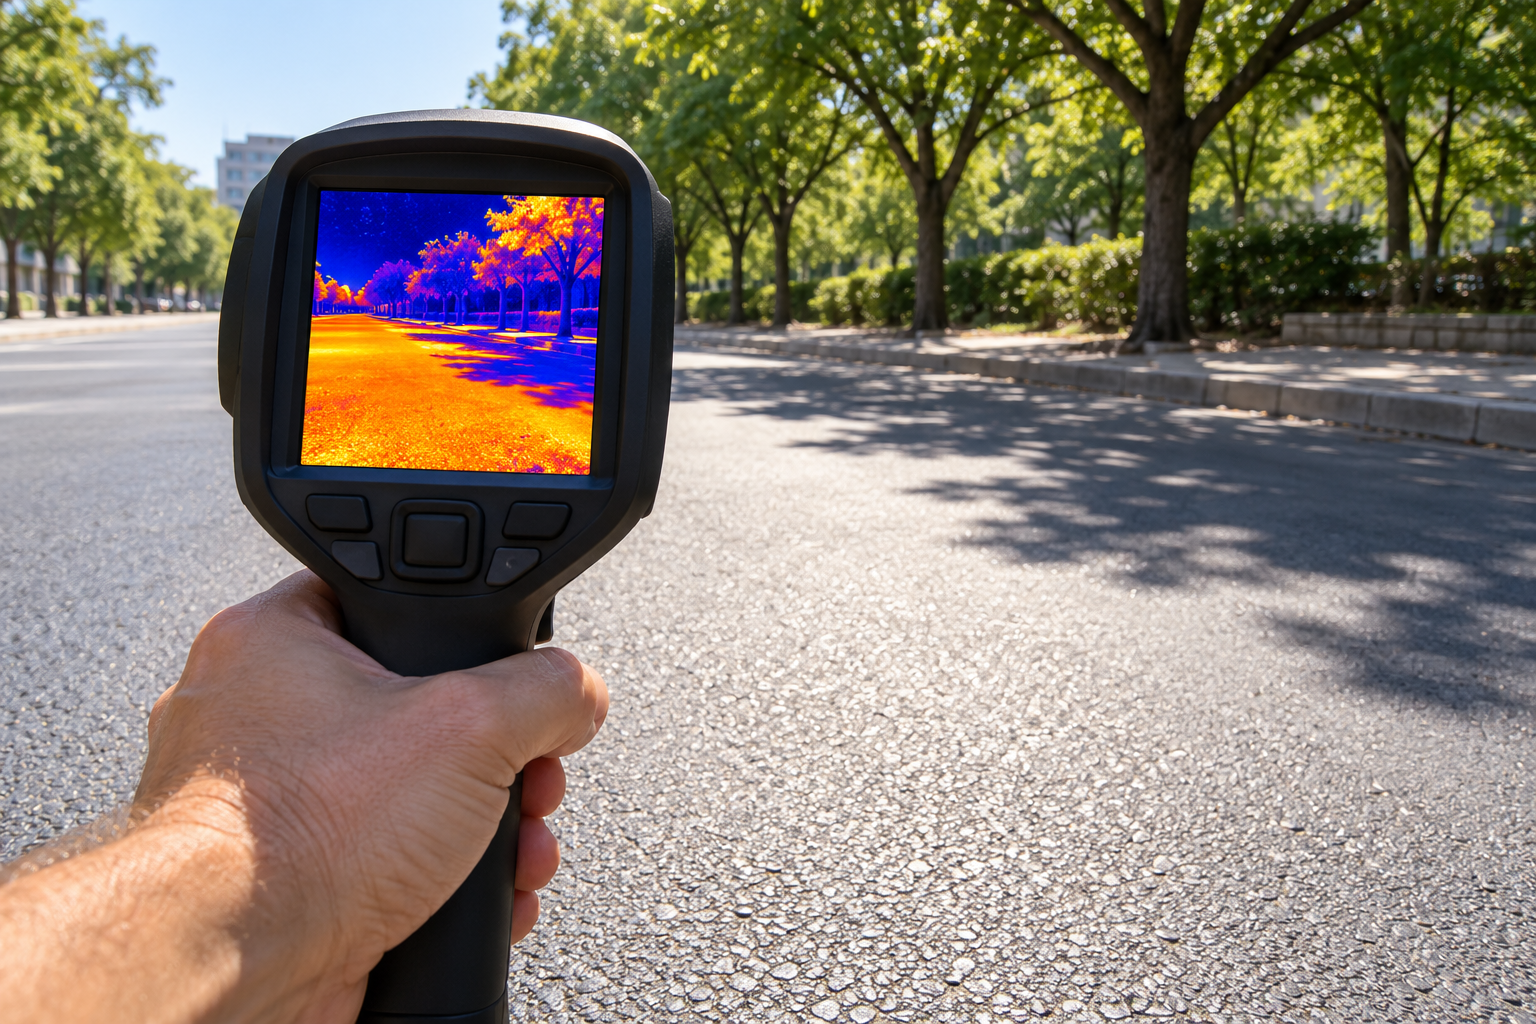
A Red Patch on a Heat Map Is Not Always the Air Temperature
A map shows part of a city glowing red, with a temperature much higher than the weather forecast. Is the forecast wrong? Not necessarily. The map may show the temperature of surfaces such as roofs and roads, while the forecast describes the air. Both can be useful without representing the same measurement.
Heat maps appear in reporting about climate change, urban planning, and neighborhood conditions. Before interpreting the most dramatic color, read the description of the data. A few basic checks can prevent a convincing image from answering the wrong question.
Identify the temperature being mapped
Land surface temperature describes the warmth of the surface observed by an instrument. From a satellite, that surface might be a roof, exposed soil, water, or the upper canopy of a tree. It is not automatically the air at the height where a person walks.
Air-temperature observations come from a different kind of measurement. A sunlit road and the air above it exchange heat, but their temperatures need not match. The relationship changes with conditions such as sunlight, wind, moisture, and the materials present.
Look for phrases such as land surface temperature, near-surface air temperature, heat index, or temperature anomaly. If the map only says heat, find its explanation before treating the numbers as comparable with a forecast.
Read the legend before judging the colors
Red has no fixed temperature meaning across maps. One map may assign red to its warmest local values; another may use the same color for a completely different range. A neighborhood that looks cooler in one image might simply be displayed using a different scale.
Also distinguish an actual temperature from an anomaly. An anomaly is a difference from a stated reference, such as an average over a particular period. A value showing how far above normal a place is does not tell you its absolute temperature without that baseline.
For a hypothetical comparison, a red area on a map spanning a narrow range might be only slightly warmer than nearby areas. The same red on another map could represent a much larger difference. Read the units and the scale instead of relying on visual intensity.
Check when and under what conditions the data were collected
A temperature map is tied to time. It may show a single observation, a daily maximum, an average of several days, or a longer-term statistic. An afternoon snapshot cannot by itself tell you which neighborhood stays warmest overnight.
Satellite observations are also constrained by when the satellite passes overhead and by the instrument’s ability to observe the surface. Clouds can limit thermal surface observations. A map assembled from clear-sky measurements is not a complete record of every weather condition.
When comparing two dates, ask whether the season, time of day, weather, and processing method are sufficiently alike. Otherwise, a difference may reflect the observation conditions rather than a lasting change in the city.
Do not mistake a small colored square for a front-door reading
A map’s pixels represent areas, not necessarily individual objects. One pixel may combine several kinds of surface. Enlarging the picture makes the squares bigger on your screen; it does not create more precise measurements.
Tree cover and tall buildings can also affect which surfaces an instrument sees. A satellite view of a leafy canopy does not directly measure every shaded pavement beneath it. Read the map’s resolution and method before assigning an exact value to a particular bench or doorway.
Local air sensors and carefully designed mobile surveys can add information at street level. Combining different observations can provide a fuller picture than expecting one satellite image to describe every part of a neighborhood.
Connect the map to the question you are asking
Surface-temperature patterns can help identify differences associated with paving, vegetation, and building materials. They can inform questions about shade, roofs, and land cover. That does not make a single image a complete assessment of what residents experience.
For planning, consider where people spend time, access to shade and cooling, and conditions inside buildings. A hot industrial roof and an unshaded place where people wait for transport may need different responses even if they appear similar on a surface map.
Climate change provides a wider context for heat planning, while local land cover influences how heat varies within a city. One neighborhood snapshot cannot quantify a long-term climate trend. That requires an appropriate record and analysis across time.
Use a short reading checklist
- What variable is shown, and in which units?
- Does the color represent a temperature or a difference from a baseline?
- What date, time, and averaging period does the map cover?
- How much ground does each pixel represent?
- Which decision can this evidence support, and what information is missing?
For immediate conditions, use current local forecasts and official heat guidance alongside any map. For a neighborhood discussion, keep the map’s limitations attached to it. A clear description of what was measured makes the image more useful, not less.